Plot ranked region set scores, annotating groups of interest
Source:R/visualization.R
plotAnnoScoreDist.RdVisualize the distribution of region set scores for region set groups of interest.
plotAnnoScoreDist(
  rsScores,
  colToPlot,
  pattern,
  patternName = pattern,
  rsNameCol = "rsName",
  alpha = 0.5,
  shape = 3
)
Arguments
| rsScores | data.frame. Each row should be a region set. Columns should include score columns and a column that contains the name of each region set. |
|---|---|
| colToPlot | character. Name of the column with region set scores to plot. |
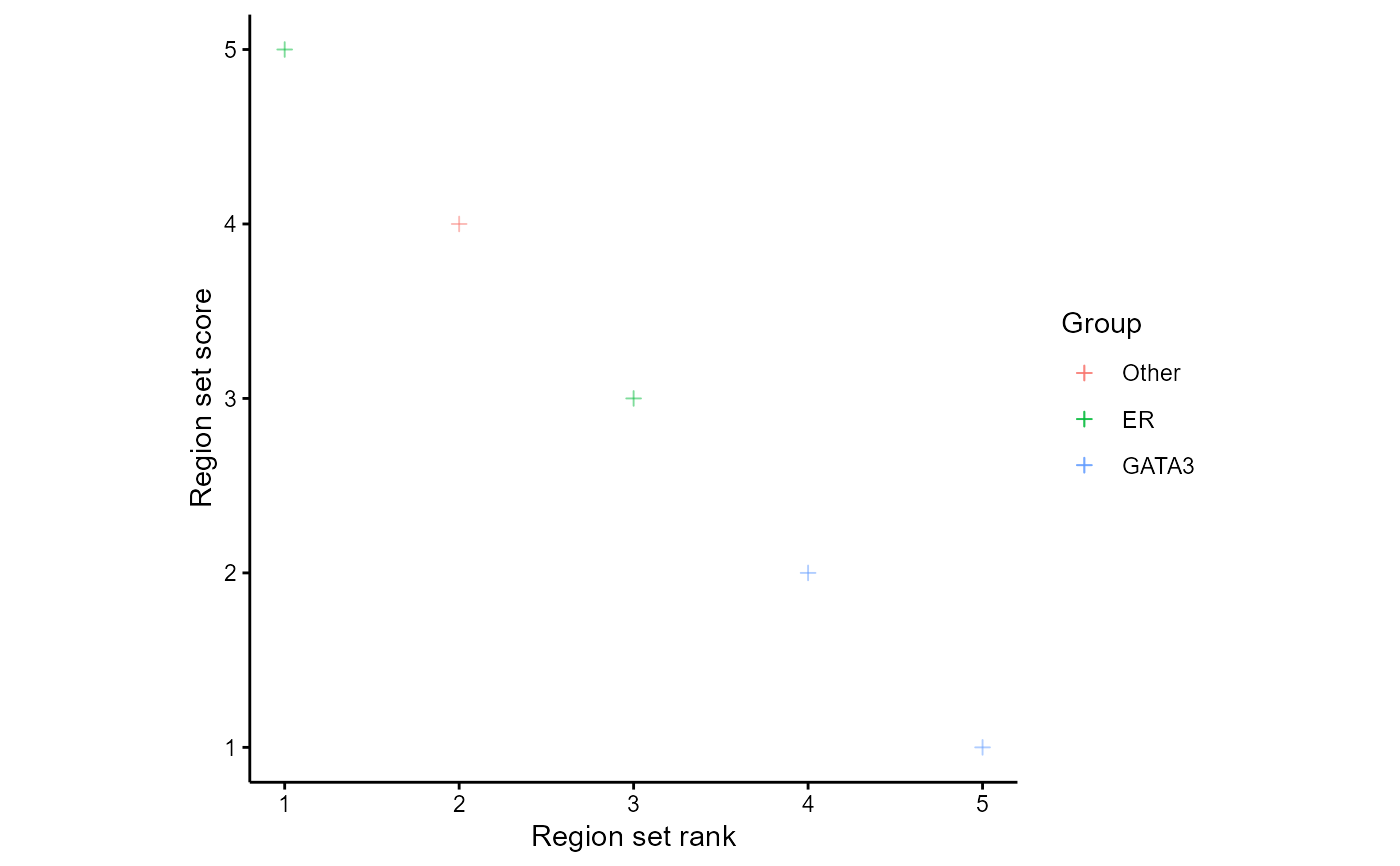
| pattern | character. Region sets that match each pattern will be given the same color. Multiple patterns can be given as character objects in a vector (each will have a different color). Regular expressions can be used (ignore.case=TRUE though). For example, to search for ER or GATA3 and color with a single color, this pattern can be given "ER|GATA3". |
| patternName | character. A name for each string in "pattern" that will be used for the legend. |
| rsNameCol | character. Column name of "rsScores" column that contains the name or description of each region set. This column will be searched for the pattern given by the "pattern" parameter. |
| alpha | numeric. Transparency of points. See ggplot documentation for further details. |
| shape | integer. Shape of the points. See ggplot documentation for options. |
Value
ggplot object that can be modified using ggplot syntax. E.g. plot + ggplot_function
Details
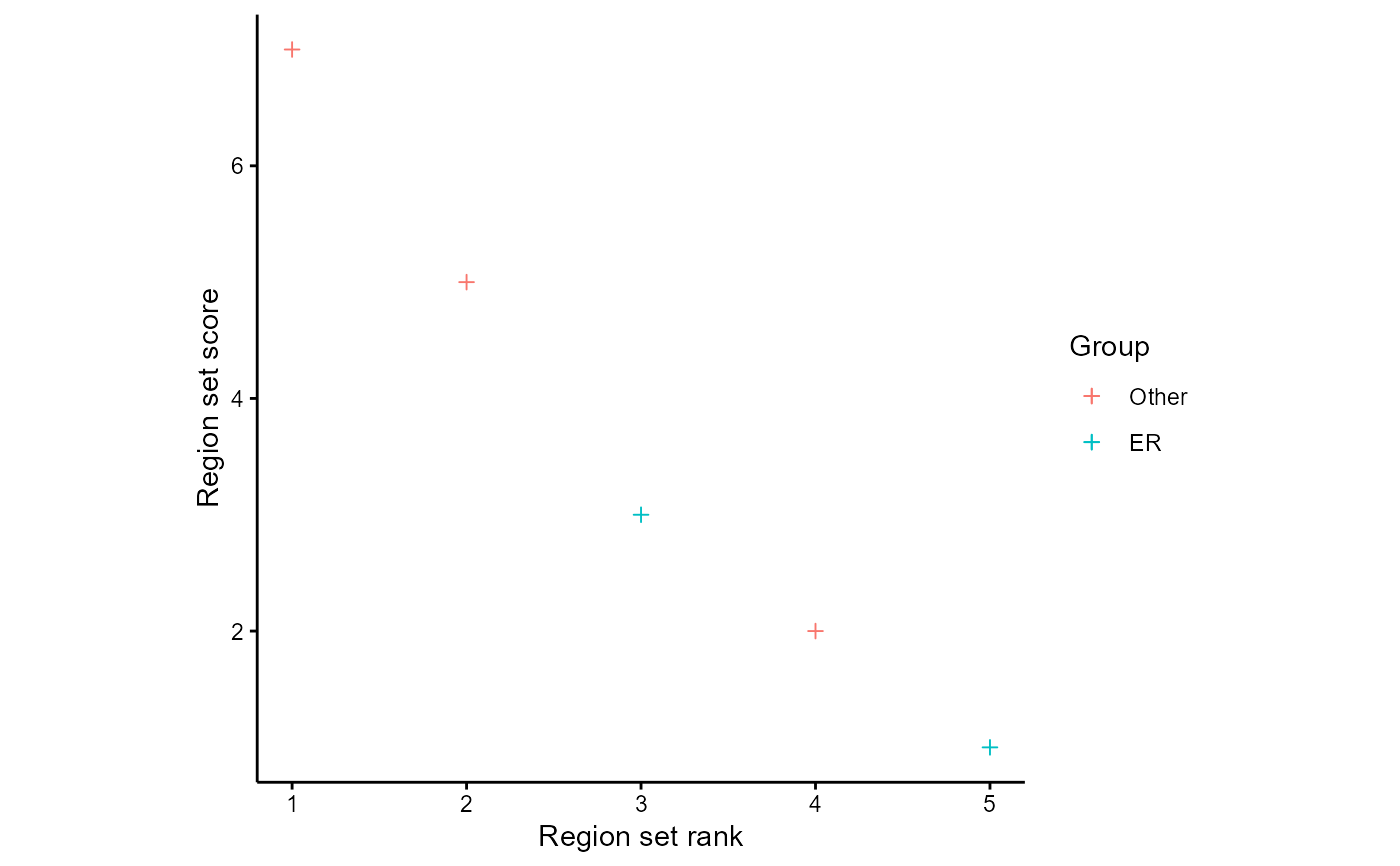
If the same region set matches two patterns, the later group will be assigned to that region set.
Examples
data(rsScores) rsScores$rsName <- c("ER", "GATA3", "ER", "GATA3", "AP1") plotAnnoScoreDist(rsScores, colToPlot="PC1", pattern="ER", alpha=1)